For many households, public charging infrastructure is necessary for electric cars to replace gasoline vehicles, while for companies or utilities, electric cars are necessary to support such an infrastructure. Which comes first?
Short answer before pondering about chicken and eggs: The growth ebbs and flows, and it depends where in the world you are. A report released Monday by the International Energy Agency, called “Global EV Outlook 2020,” helps highlight that with some simple pie charts.
Globally the number of publicly accessible chargers of all types increased by 60% in 2019 versus 2018—a higher rate than the vehicle growth itself.
Americans have more single-family households, driveways, and garages than in many other parts of the world. As of 2019, the U.S. had about 12% of the global stock of the world’s 7.2 million EVs, but 24% of the global private (slow) chargers in the world.

Private slow chargers by country - IEA, 2020

Public slow chargers by country - IEA, 2020

Public fast chargers by country - IEA, 2020
When you switch to publicly accessible chargers, the U.S. looks markedly less prepared. The U.S. has 11% of the world’s publicly accessible public (slow) chargers, and just 5% of the world’s public fast chargers (versus about 6% for Europe). China, on the other hand, has 82% of the world’s fast chargers.
A recent report by the market-research firm Wood Mackenzie anticipated that Europe will pull ahead of the U.S. in fast-charging infrastructure but it will catch up by 2030—perhaps with the greater charging-infrastructure spending that’s proposed in Congress.
The EIA predicts that total global passenger car sales will decline in 2020 by 15% while EVs will hold the line, essentially matching their 2.1 million sales total from 2019.
Up until this past year, global EV sales grew by at least 30 percent annually, according to IEA. In 2019 that growth slowed to 6%, yet they managed their highest-ever market share in 2019, with 2.6% of the global vehicle market.

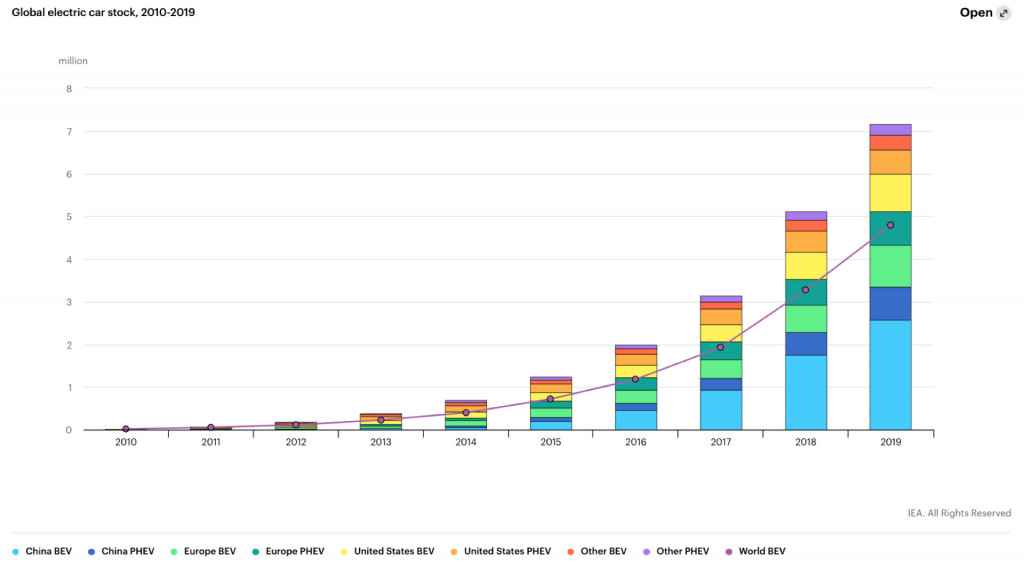
Global electric vehicle stock through 2019 - IEA, 2020
According to the IEA, that resulted in a total electric-vehicle stock of 880,000 in the U.S. and 3.79 million in the world.
China again exceeded one million EV sales in 2019, although its sales were down 2% versus the year earlier. Europe was second globally, at 561,000, and the U.S. had 327,000 EV sales. And the expiration of the U.S. EV tax credit for GM and Tesla contributed to a 10% drop in BEV sales in the U.S. over the year, it noted—while sales in Europe rose by 50%.
Two different trajectories for preparing the grid
As the IEA emphasized, the way that governments respond to the coronavirus crisis and aid economic recoveries will affect the pace of the transition to EVs. France and Germany, for instance, have already announced plans to incentivize EVs as part of the recovery, but so far the U.S. hasn’t created any such program.
To reflect this range of responses (or the complete lack of them, in some cases), the IEA also provided two very different scenarios for the adoption of electric vehicles by 2030. Under a so-called Stated Policies Scenario, existing government policies would be followed for the rest of the decade. Under a more aggressive Sustainable Development Scenario (also assuming lower emissions in power generation), the targets of the Paris Agreement would be followed, to a goal of a 30% market share for all modes of transit (except two-wheelers) by 2030—reflecting 36% annual growth until then.

Artist's impression of Ultium Cells' battery plant in Lordstown, Ohio
Under the more aggressive scenario, battery electric vehicles would account for about 4% of global electricity demand—up from just 0.3% today. By 2030, global electricity demand for electric cars will rise to 550 terawatt-hours under the first scenario, or nearly 1,000 Twh under the second scenario—representing 6 and 11 times the current electricity needs, or 2.5 million to 4.2 million barrels per day of gasoline and diesel.
Cobalt and nickel demand are continued issues for the electric-vehicle sector. Under the more aggressive projection, the annual demand for cobalt climbs toward 400 kilotons per year—or roughly double that under the weaker scenario.
In the annual report, the IEA also emphasized the importance of end-of-life battery uses—in grid storage, for instance—and in integrating batteries with power systems to help smooth out peak and off-peak periods.
