Recent Updates
09/30/2024 12:00 PM
Original or remaster? Electric MGB faces new Cyberster
09/30/2024 12:00 AM
Cupra Terramar
09/28/2024 12:00 PM
How we're updating the Autocar road test
09/28/2024 12:00 PM
“I’m not convinced there’s a market for electric hypercarsâ€
09/28/2024 12:00 AM
McLaren confirms W1 name for F1, P1 successor
09/27/2024 12:00 PM
BMW Z4
09/27/2024 12:00 PM
Hyundai Ioniq 5
09/27/2024 12:00 AM
Mazda CX-80
09/27/2024 12:00 AM
Mercedes could axe GLC, GLE coupé-SUVs
09/27/2024 12:00 AM
Nominations open for 2025 Autocar Drivers of Change initiative
EV, Hybrid, Hydrogen, Solar & more 21st century mobility!
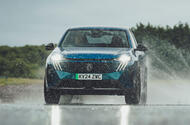 As the our road test forges into its second century, its brief is expanding – and it’s returning to a familiar place
Keeping something up to date without significantly changing what it is in the process isn’t an easy brief. Just ask any ageing rock musician, grand hotel proprietor… or car maker.
Everything must change, of course, and only products that are relevant and well attuned to their purpose can retain their value.
The Autocar road test has changed quite a lot over what we now know to be more than a century, taking in close to 6000 fully instrumented tests. Its content has necessarily morphed and developed as the cars it was conceived to scrutinise have evolved.
If it hadn’t, we’d still be fretting over how much physical pedal effort it takes to stop a Porsche 911 GT3 from 70mph, or how much engine oil the latest Volkswagen Golf GTI might consume in a week.
As the automotive landscape has changed quite radically over the past 10 years, we’re now making a few more changes to the road test, so that it can continue to provide what we believe to be the best, most relevant and most thorough assessment of a new car anywhere in the world.
We were also delighted to find out, as a result of a recent reader survey, that you broadly agree with these sentiments, and rank the road test among the most valuable and successful things that Autocar does. The road test editor thanks you for the vote of confidence (we like it too, btw).
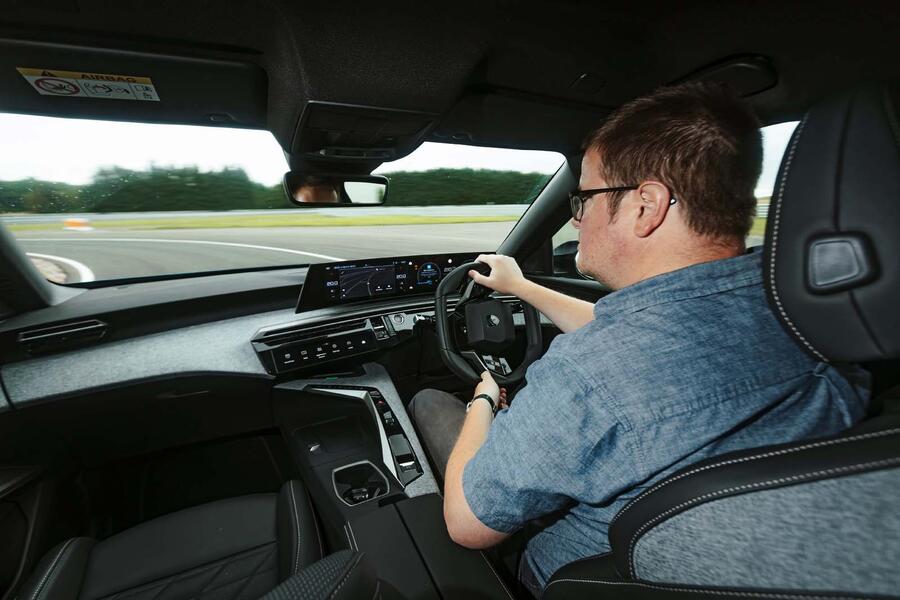
So now, apart from everything else, you’ll be getting more road tests. In place of one per issue, more often than not you’ll be getting two from now on – one of six pages in length, the other four.
When there’s a test subject enticing, interesting or significant enough to justify it, you’ll get one test of 10 pages instead. Over the course of a typical month, we reckon we’ll be delivering 60-80% more instrumented tests than before.
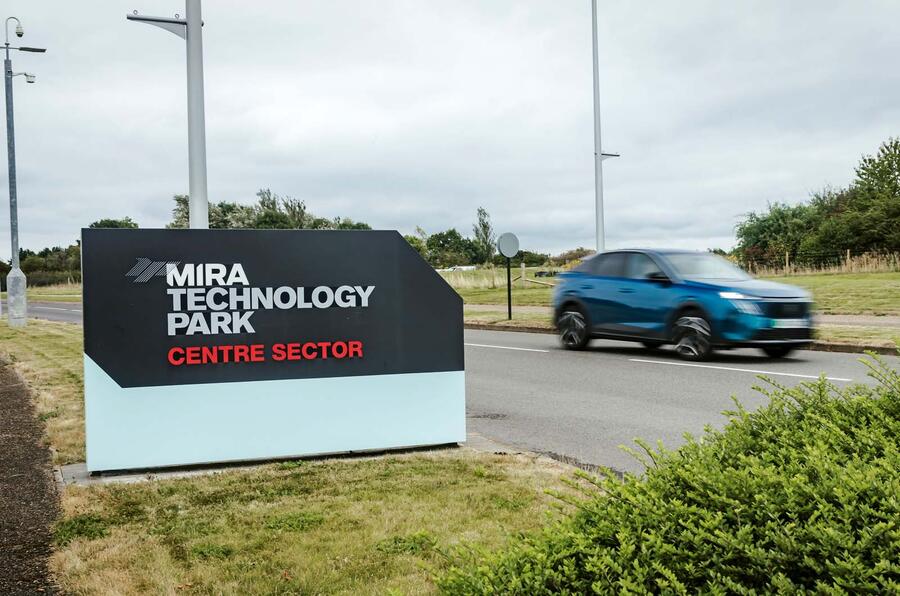
So we’ll be busy – and, to a great extent, busy in the West Midlands. That’s because we’ve returned to an old stomping ground as a basis of operations for the weekly benchmarking of our test cars: the Horiba MIRA proving ground not far east of Birmingham.
So, for us, it’s farewell to Millbrook’s Bedfordshire take on an Alpine hill route and high-speed bowl for the foreseeable future, and hello to the different blend of circuits, facilities and possibilities that MIRA affords.
It’s farther from Autocar Towers in west London, certainly, but as I may have pointed out once or twice before, the magnificence of the MIRA canteen usually makes it worth the trip all on its own.
The move has given us a chance to review the test procedures through which we put test subjects, and to expand a few of them where value can be added.
Given that more than half of the newly introduced production cars that we’ve been testing for the past few years have been either fully electric or significantly electrified, the procedures we’ve added and changed are mostly intended to give extra insight into the performance of those cars, but almost all of the existing performance, handling and braking tests we were doing before survive.
Electrified cars can be expected to become slower as their drive batteries go flat – quite the opposite of cars with internal combustion engines and fuel tanks – and so, from now on, the Autocar road test will tell you precisely how much slower they get.
These cars also tend to deliver energy-efficient motoring in a different way from combustion-engined ones, so we’ve developed a new efficiency test schedule to better reflect their capabilities.
Which is to say nothing of what has probably become the most impactful performance characteristic of any electric vehicle in 2024: how long it takes to charge.
While other reviews blindly repeat manufacturer claims on this, the Autocar road test will continue to independently and empirically benchmark DC rapid-charging performance, and then deliver a weighted-average kW charging rate result that is a true and useful reflection of a car’s real-world rapid-charging potential.
If you’re an EV owner already and simply want to spend less time waiting at cafes and motorway service areas, this might be the most important piece of data that the road test tells you.
But it will continue to be only one of a great many, each intended to build up a picture of a new car’s performance, practicality, wider capability and all-round character more complete than any you’ll read elsewhere.
Among other things, the road test will also continue to critically assess the integration and tuning of the latest driver assistance systems.
It will remain flexible enough to appraise circuit performance and stamina, on cars where that’s appropriate, and off-road capability too, where relevant.
It could always do more, of course, and will no doubt keep changing in order to survive another century, so if there are things you’d like the Autocar road test to tell you that, even now, it misses, please write to us with your suggestions. Otherwise, we hope you will continue to enjoy reading them as much as we enjoy making them.Â
The Tests
Acceleration at low chargeAny car that relies on an electric motor and a battery for either a part or all of its propulsion depends on the condition of that battery for its power, so we have added a second benchmark test of a car’s acceleration.
With any EV or hybrid vehicle, our primary acceleration test is always performed with the drive battery’s state of charge at a minimum of 90%. For the new second test, that battery is depleted to 10% state of charge.
This will give a useful indication of real-world performance for people who tend to drive plug-in hybrids over longer distances once the battery is flat, but also of the robustness and integrity of the powertrain engineering, and effective power management, of any electric car.
Braking endurance
Thanks to standard anti-lock and electronic stability control systems, as well as brake energy regeneration systems, today’s cars don’t routinely depend on the physical power of their friction brakes like their predecessors did.
But they have typically become heavier than those predecessors, while the rise of electrification seems to be tempting some manufacturers to save cost and weight in their physical braking systems.
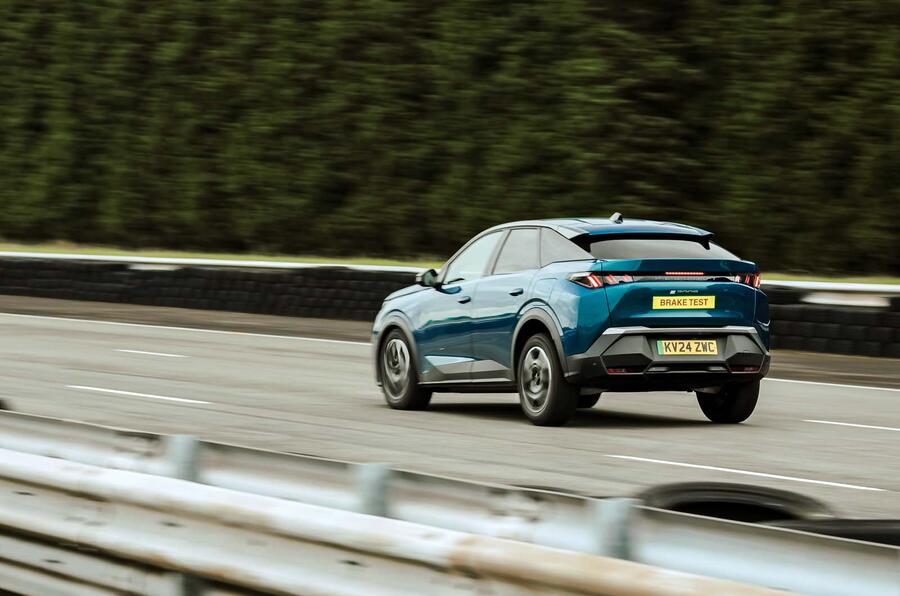
The fallout of all this should be picked up by our new braking endurance test. All test cars will do five full-pedal-pressure brake test stops from an indicated 80mph in quick succession.
Thirty seconds of brake cooling running will be undertaken between each one, but that won’t be enough to cover for any car that’s skimping on old-fashioned stopping power, and suffering from gathering fade, or worse, as a result.
Fuel efficiency
We will continue to produce both track and touring fuel economy test results for every road test: the former simply the result of what the trip computer displays (having been reset before our track benchmarking session), the latter of a roughly 10-mile trip at typical UK motorway speeds around MIRA’s ‘Number 1’ banked high-speed circuit.
But because neither our touring nor our test average result shows the potential of electrified cars for efficiency over shorter-range trips, a fourth test schedule is being added that we’re calling ‘everyday’ (think of it as ‘ordinary’ or ‘commuter’, if you prefer). It’s a roughly eight-mile test, a quarter of which is carried out at 20mph, 30mph, 40mph and 50mph respectively, with regular corners, stops and restarts included.
Experience so far suggests that EVs can return up to 50% better efficiency on it than on our touring test, and that hybrids also do well, when given a chance to cover distance a little more slowly, and to regenerate energy more often.
DC rapid-charge speed
Technically this isn’t brand new for our redesigned road test, but it’s increasingly important. When car manufacturers make claims about the DC rapid-charging performance of their latest models, they tend only to refer to peak rapid-charging rate, which can now even exceed 300kW.
Although some also include an indicative 10-80% recharge time, few go into more detail about real-world rapid-charge performance.
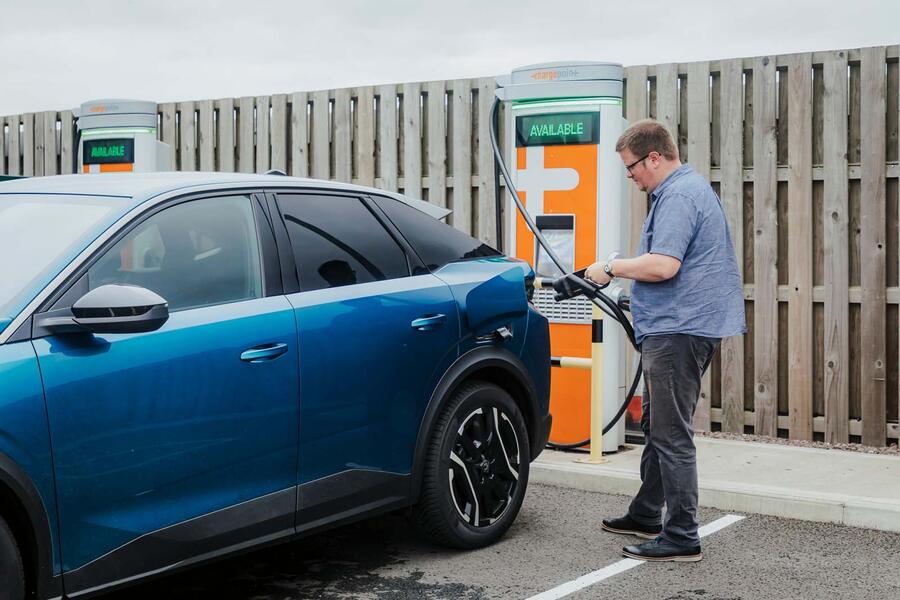
And so, since 2022, the Autocar road test has been scrutinising it. All EVs go through a benchmark rapid-charge test, from below 10% state of charge to above 90%, connected to a rapid charger capable of supplying their peak claimed charging power.
Actual charging rate is then recorded as state of charge passes 10%, 30%, 50%, 70% and 90%, and a weighted average result is calculated that more accurately reflects real-world charging speed than any ‘peak’ claim.
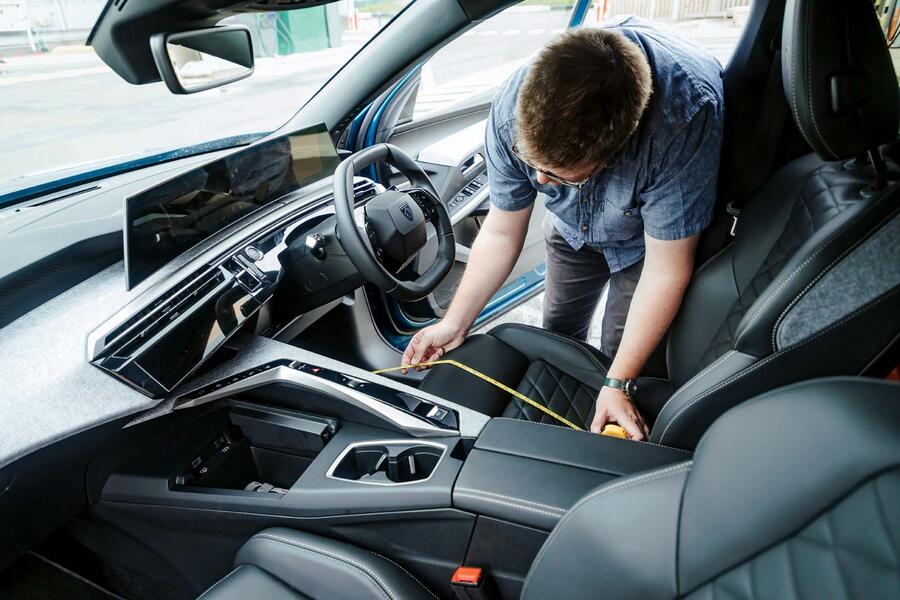
And everything elseThe rest of our road testing process remains exactly as it was. With the car static, it takes in notation of fitted tyre sizes, and the measurement of as-tested kerb weight, of a few key exterior dimensions, of passenger cabin accommodation levels and of boot space.
The way these measurements are taken has developed over time, so rather than measuring maximum and minimum rear leg room, for example, we set the front seat for a typical driver (at mid-height, and exactly a metre from the brake pedal), and then measure what ‘typical’ leg room is left in the back.
Our dynamic track tests give us repeatable measures of both in-gear and through-gear acceleration; of both wet- and dry-surface stopping distances; of in-cabin cruising and idling noise levels; and, more subjectively, of both wet- and dry-surface limit handling.
Each test car also typically does several hundred miles of on-road test mileage, the impression of which forms the most important component part of our verdict.
