Now that our digital archive is complete, the possibility of taking a long-term view of inflation is intriguing
Inflation has been a subject on everyone’s lips in 2024, not least with regards to new car prices, which we were recently told had risen 129% over the past 15 years. Goodness gracious!
Now, with the few gaps in Autocar’s digital archive having been filled, the possibility of taking a long-term view is intriguing.
Working out an average price of the cars featuring in our weekly road test (which admittedly is probably skewed towards the higher end of the market) since World War II reveals that car prices remained fairly flat until the 1980s, when they suddenly soared and have since maintained that trajectory.
Enjoy full access to the complete Autocar archive at the magazineshop.com
Of course, that the average road test subject cost £1016 in 1950 doesn’t tell us much, because it seems an absurdly small amount of money today.
Unless you can remember life back then, you have no concept of how much that sum was actually worth. So let’s adjust that £1016 for historical inflation, giving us an equivalent in modern money.
That’s £28,781, the Bank of England’s calculator tells us. Wow: it seems remarkably cheap, considering that the average road test subject in 2022 was £70,054.
Or, to put it another way, a Jowett Jupiter roadster in 1950 cost essentially the same as a Mazda MX-5 does today – which might seem reasonable to you.

Yet anyone who was around in the 1950s will tell you that the Jupiter was hardly an affordable option for most people.
My own grandmother recalls that when she was a child, merely the distant sound of an engine signalled that her stepfather was arriving home from work, because his Austin A90 was the only car that lived on their south London street.
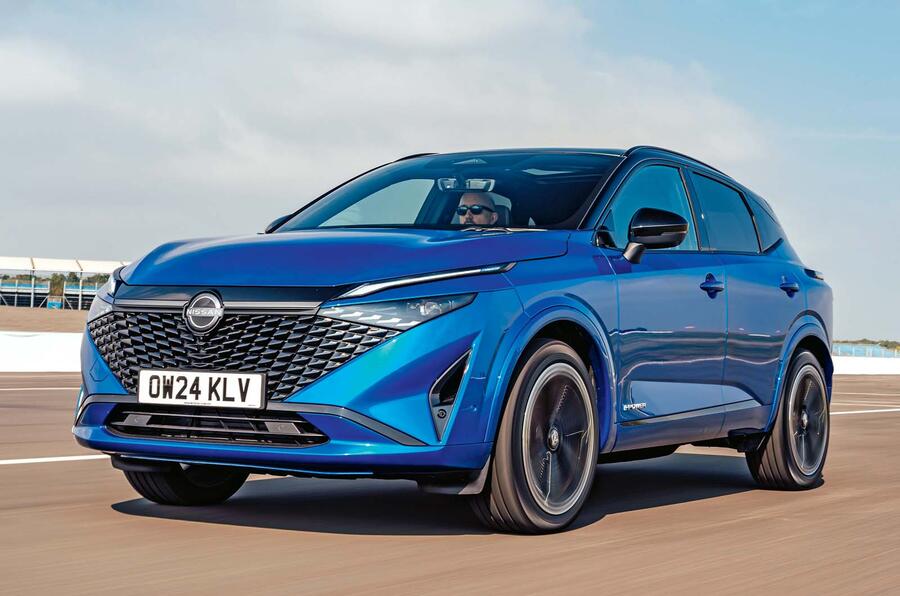
So, not only did her neighbours not each own a Morris Minor Tourer (the cheapest car we tested in 1950), despite one costing the equivalent of only £11,080 in today’s money (actually £2715 less than the cheapest car of today, the Dacia Sandero), but also someone as affluent as a surgery-owning dentist would proudly have been able to own a Nissan Qashqai equivalent.
What gives? Well, the method we’ve been using to adjust the prices is based on a blend of the Bank of England’s modern Consumer Price Index and older Retail Price Index data – measures of the cost of living.
But the growth of the UK economy over the decades has increased people’s real income, meaning that even though commodity prices have continually inflated, people have had more and more to spend.
In 1950, people simply consumed a lot less; that A90 would have been a much more significant investment for old Gordon than a Qashqai would be for a dentist today.

Measuring Worth is a fascinating academic project that has created an inflation calculator to provide some illustration of this.
One of the measures it offers is a labour value – calculated as the multiple of the average wage that a worker would need to buy a commodity, such as a car.
All of a sudden that A90 was really worth more like £122,600, the same as a Mercedes S-Class today, and the Morris more like £43,200, or a BMW 4 Series.
Look at the graph below and you can see that the gap between our two measures of inflation closes rapidly through the 1950s as Britain rebuilt its economy after the war, closed up significantly through the 1980s and 1990s and converged in the mid-2000s – about the time when the UK’s economy and the increase in the average standard of living entered the period of stagnation that persists today.
An interesting side note to all this is the comparison to that other major investment that we all wish to make: a home.
According to data from Nationwide, the average house price tracked almost equally with the average road test car price until 1970, when it started gently climbing away; by the mid-1980s, it was three times higher, from a low base level; and since the late 1990s, it has rocketed away, such that it’s four times higher from a high base level – all while wages have stalled.
It seems, then, that the best time to have settled down with a house and a nice car was in the late 1970s – so congratulations if you lucked out there.


